


In this section we have included emissions from three phases of the life cycle of automobiles in the calculation. Phase 1 includes the extraction and processing of the materials needed to manufacture the vehicle (Steel, Iron, Aluminum, Copper, Plastic, etc.). Phase 2 refers to the production processes (Stamping, Molding, Spinning, Machining, Welding, Painting, etc.). Phase 3 indicates the emissions due to use, based on the distance traveled. The recycling and disposal phase has not been included because there is still little experience of it, particularly in the case of electric cars, and in any case it is a small amount in relation to the whole. We have divided the analysis into seven segments (Utility & Compact, Estate, Sedan, Small Minivan, Family Minivan, Small SUV and Large SUV), depending on the size of the car. The calculation has been made from the five best-selling models in 2018 for each segment.
The calculations of phase 1 and 2 have been made based on the average emission for the different materials by the weight of the vehicle. The proportions changed a bit in the case of electric cars. To these, in addition, the emissions caused by the manufacture of the high-voltage battery are added, depending on its load capacity (kW). A standard value of 110 kgCO2e/kWh has been used for this calculation.
Phase 3 has been calculated from the average consumption of the different models (in l/100 km), applying the standard emission factors for Spain in 2018 (2,157 kgCO2e/l for gasoline and 2,493 kgCO2e/l for diesel). To calculate the compressed natural gas cars, we used the emission factor provided by the Catalan Climate Agency (2,71 kgCO2e/kg CNG). In all cases, we have assumed an average car life of 200,000 km. For electric cars, two consumptions have been applied, one assuming that all electricity comes from renewable sources (zero emissions are assumed) and the other applying the average emissions of the Spanish electric mix (0.246 kgCO2e/kWh in 2018 according to REE).
Gasoline passenger cars
(Value in kgCO2e of the complete life cycle)
| TYPE | PHASE 1 | PHASE 2 | PHASE 3 | TOTAL |
|---|---|---|---|---|
| Sub-compact cars | 4.716 | 2.001 | 27.495 | 34.211 |
| Family car | 6.193 | 2.379 | 33.088 | 41.660 |
| Sedan | 7.418 | 2.692 | 34.383 | 44.493 |
| Small minivan | 5.663 | 2.243 | 31.190 | 39.096 |
| Family minivan | 6.933 | 2.568 | 36.281 | 45.783 |
| Small SUV | 5.640 | 2.237 | 30.500 | 38.377 |
| Large SUV | 7.817 | 2.794 | 42.709 | 53.320 |
Turismos de gasoil
(Value in kgCO2e of the complete life cycle)
| TYPE | PHASE 1 | PHASE 2 | PHASE 3 | TOTAL |
|---|---|---|---|---|
| Sub-compact cars | 5.415 | 2.180 | 25.478 | 33.073 |
| Family car | 6.345 | 2.418 | 29.766 | 38.529 |
| Sedan | 7.445 | 2.699 | 33.157 | 43.301 |
| Small minivan | 5.878 | 2.298 | 26.476 | 34.652 |
| Family minivan | 7.510 | 2.716 | 34.703 | 44.929 |
| Small SUV | 5.801 | 2.279 | 28.146 | 36.226 |
| Large SUV | 7.962 | 2.832 | 39.689 | 50.482 |
Battery electric cars
(Value in kgCO2e of the complete life cycle)
| TYPE | PHASE 1 | PHASE 2 | PHASE 31 | TOTAL1 | TOTAL2 |
|---|---|---|---|---|---|
| Sub-compact cars (<25kW) | 5.971 | 1.718 | 5.904 | 13.594 | 7.690 |
| Compact cars (25-40kW) | 8.450 | 1.948 | 7.380 | 17.778 | 10.398 |
| Sedan (40-75kW) | 14.350 | 2.692 | 8.856 | 25.899 | 17.043 |
| Small SUV (<65kW) | 11.392 | 2.237 | 7.872 | 21.502 | 13.630 |
| Large SUV (>65kW) | 16.967 | 2.794 | 8.856 | 28.617 | 19.761 |
(1) Using the Spanish electric mix
(2) Using electrical energy of renewable origin. Direct emissions are assumed = 0
Cars with natural gas
(Value in kgCO2e of the complete life cycle)
| TYPE | PHASE 1 | PHASE 2 | PHASE 3 | TOTAL |
|---|---|---|---|---|
| Sub-compact cars | 4.716 | 2.001 | 20.000 | 26.717 |
| Family car | 6.193 | 2.379 | 22.000 | 30.572 |
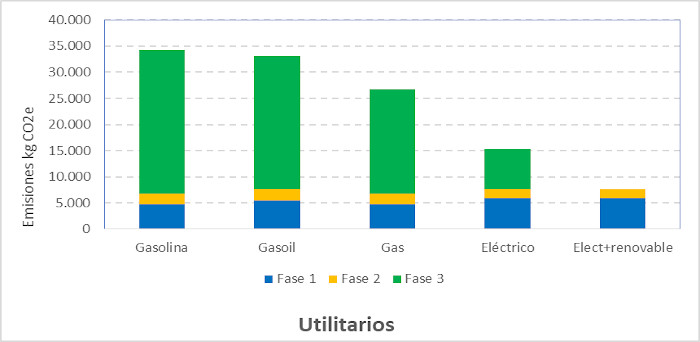
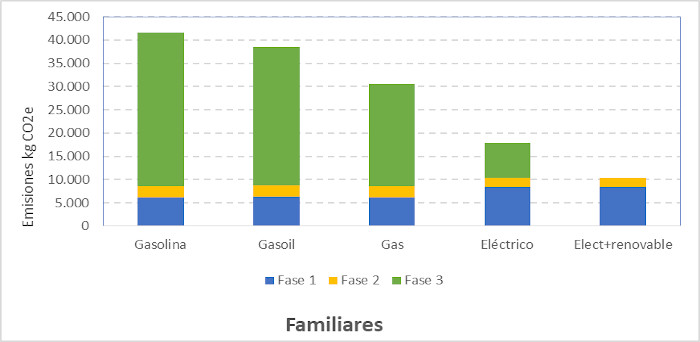
Cars: comparison by type of fuel
We presented two examples of the CF of the best-selling cars: utility and family, including the different phases of the life cycle by type of fuel. In both cases, the electric car offers the lowest emissions, especially when it is powered by renewable energy. In this case, it represents 25% and 29% of the emissions produced by a gasoline utility vehicle and family, respectively, and 26% and 31% of its diesel equivalents.
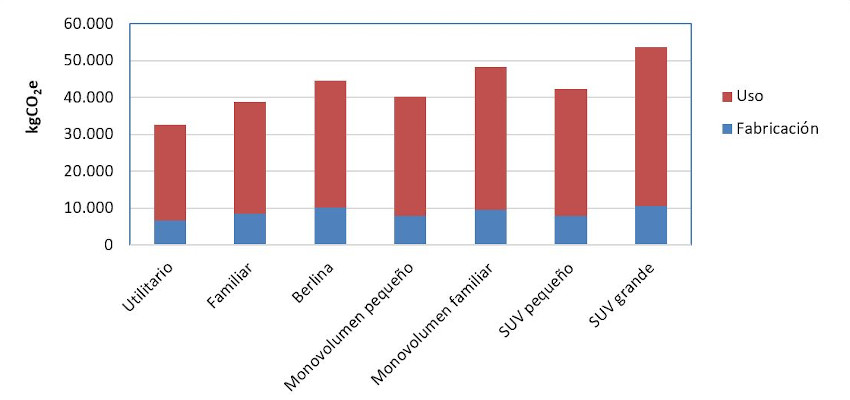
Passenger cars: comparison by car size
Comparison of gasoline cars by size is included, including the production and use phase.
Motorcycles
(Value in kgCO2e of the complete life cycle)
For Motorcycles, a useful life of 12 years is assumed, with an average use of 5000 km per year. An average consumption per cylinder capacity has been included. For electrics, a medium-size 8 kW battery is assumed, with a standard consumption of 7 kW / 100 km. Same ratio of emissions from the manufacture of batteries as in electric cars.
| TYPE | PHASE 1 and 2 | PHASE 3 | TOTAL |
|---|---|---|---|
| <125cc | 3.500 | 3.236 | 6.736 |
| 125-500cc | 3.600 | 5.177 | 8.777 |
| >500cc | 3.700 | 7.765 | 11.465 |
| Electric(8kW) Spanish national mix | 4.888 | 1.107 | 5.995 |
| Electric(8kW) renewable | 4.888 | 0 | 4.888 |