Fundacion Tatiana Catedra etica ambiental UAH Universidad de Alcala
glaciar
CO2Web Observatorio Online
BASICS

CLIMATE CHANGE

THE SCIENTIFIC BASIS FOR THE HYPOTHESIS OF HUMAN-INDUCED CLIAMTE CHANGE IS BEAMING INCREASINGLY SOLID.

The scientific basis that support the hypothesis of human-induced climate change is very solid, since we observe a large number of phenomena in different disciplines that point in the same direction. Although each of these observations has a logical margin of uncertainty (errors associated with the measurements, for example), the great variety of phenomena and the consistency between them makes convergence increasingly evident and less and less justified to deny it.

As is well known, there have been numerous climatic changes in the geological history of the planet. We also know various natural factors that explain these variations (Earth's orbital cycles, plate movement, volcanism, etc.). However, what we are now observing has an unprecedented rate of change, and cannot be explained by the natural phenomena mentioned above, which allows us to point to human action as the protagonist. Faced with those who still consider that human action is marginal, and that it is incapable of having a planetary impact, suffice it to say that the Nobel Prize in chemistry Paul J. Crutzen coined the term Anthropocene to refer to the magnitude and extent of environmental change introduced by human beings. Scientific acceptance of the term is quite wide, evidencing the recognition of the global impact of the human footprint in many natural processes. This impact can be seen more immediately in the images acquired by earth observation satellites for several decades, which show the undeniable impacts of the footprint: drying of wetlands or construction of reservoirs, deforestation and agricultural expansion, urban growth, mining, etc. (There are abundant examples of these impacts at https://earthengine.google.com/timelapse/ rom Landsat images).

Whenever the hypothesis of climate change of human origin is criticized, with some frequency observations are crudely mixed with models, facts proven with other probable ones, refuting the former with the uncertainties associated with the latter. In this sense, it is convenient to distinguish what the facts indicate, what we know about the causes and what we estimate about the consequences.

The following data are quite obviously associated with global warming:

1

The 19 warmest years on the temperature record (from 1880) have occurred from 1998 to the present, with a temperature increase of 0.87 above the 1950-1980 mean: http://climate.nasa.gov/vital-signs/global-temperature/, with 2016 being the hottest so far. Logically, these values ​​correct the urban heat island effects. Similar trends are observed in the temperature of the sea water, unaffected by this phenomenon. The figure shows the thermal differences between the beginning of the instrumental record and the current situation:

Mapa de temperaturas siglo XIX Mapa de temperaturas siglo XXI 19th century temperature map, 21st century temperature map. Difference in temperatures between the end of the 19th C., and second decade of the 21ST C., (the temperature scale goes from + 2ºC to -2ºC)
Source: https://svs.gsfc.nasa.gov/4626

2

From satellite measurements, a loss of almost 4 million km2 of summer sea ice in the Arctic has been observed between 1980 and 2015 (the lowest value measured was in 2012: http://nsidc.org/arcticseaicenews/).

A significant loss of continental ice is also observed in Greenland. Although the effect is less evident in Antarctica, significant losses are also recorded in the western sector, the most massive. Likewise, it is observed that the vast majority of the world's glaciers are losing length and volume, in different latitudes and hemispheres.

Variaciones de la superficie de hielo marino en el Ártico al final del invierno y del verano
Sea ice surface variations in the Arctic in late winter and late summer
(http://polarportal.dk/en/sea-ice-and-icebergs/understanding-the-arctic-sea-ice/)

3

Measurements made with radar altimeters from satellite have shown a sea level rise of about 3.3 mm/year for the last 25 years, with a clear upward trend, which has accelerated in the last 10 years ( http://www.esa-sealevel-cci.org/Sea%20Level%20information).

Variaciones de la altura del océano a partir de altímetros radar
Variations in ocean height from radar altimeters(http://www.esa-sealevel-cci.org/node/284)

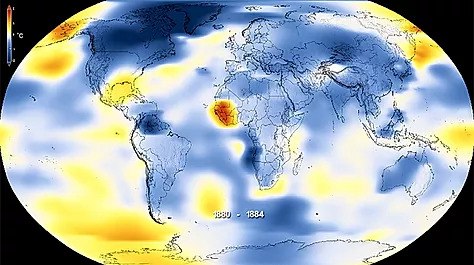
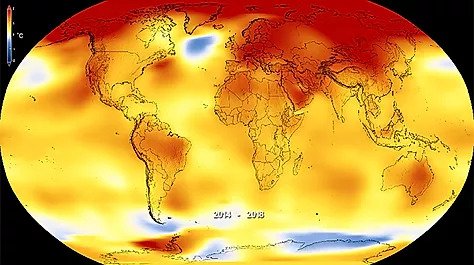
Obviously, throughout the geological history of the Earth, there have been multiple climatic changes, due to different natural factors. What is unique about the present situation we are now observing is the speed with which it occurs and its causes. At the present time, there are no variations in incident solar radiation, or exceptional volcanic activity or other natural factors that could explain the variation in temperature. There is evidence of an increase in the density in the atmosphere of carbon dioxide (CO2) and other gases that retain the solar radiation emitted from the earth's surface. Hence the common name of these compounds, greenhouse gases (GHG), because - like glass and other materials - they allow incident solar radiation to pass through, but filter part of the thermal radiation, thus increasing the temperature of the system. The greenhouse effect is very beneficial for life on Earth (without an atmosphere our temperature would be 33 degrees lower), but if we sharply increase the density - as it has been happening in recent decades - the effect of excessive and rapid warming will have very negative global effects.

We have no doubt that the concentration of CO2 in the atmosphere has increased notably since the pre-industrial period, going from 280 parts per million (ppm) in the middle of the 19th C., at more than 410 ppm today. In addition to CO2, other GHGs are notably increasing their concentration, from 700 to 1890 parts per billion (ppb) for methane (CH4) or from 270 to 337 ppb for nitrogen oxides (N2O). The main thermal effect, based on its abundance, is that of CO2 with an estimated global radiative increase of almost 2W / m2.

There is also no reasonable doubt about the origin of these increases in GHG concentration. Regarding CO2, the emission from volcanoes is estimated at around 1% of the emissions of human origin (Hards, 2005). Of these, calculated at about 37 Gt of CO2 per year (http://www.globalcarbonproject.org/), it is estimated that 90% come from the burning of fossil fuels and cement production and the rest emerges from the change in coverage of the soil (degradation and burning of forests that are converted to crops).

Variación en las emisiones de GEI anuales como consecuencia de la quema de combustibles fósiles y las transformaciones del uso del suelo
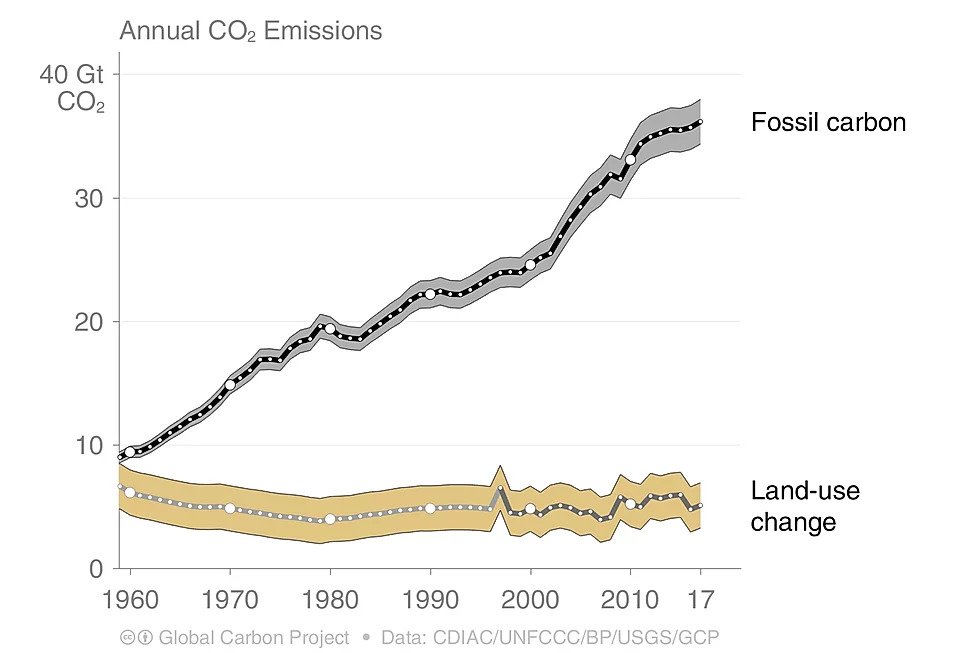
Variation in annual GHG emissions as a consequence of the burning of fossil fuels and changes in land use (http://www.globalcarbonproject.org/)

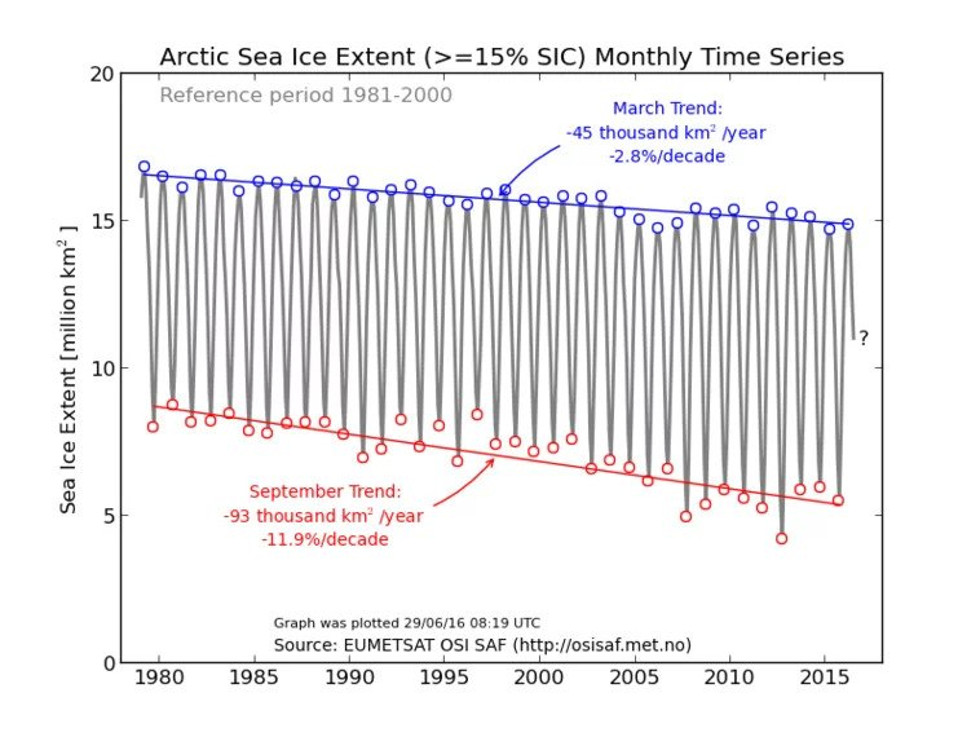
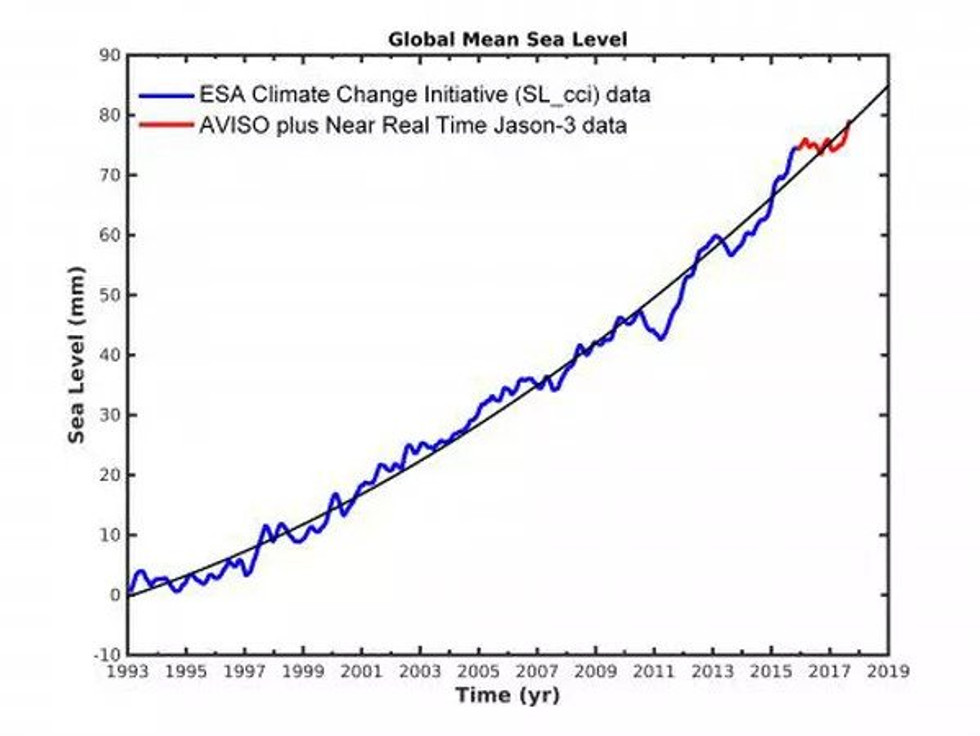
Finally, regarding the foreseeable impacts of this warming, the uncertainty is greater, since the complexity of the climate models and the emission scenarios that may occur comes into play. However, it should be remembered that the most prestigious meteorological centers in the world (Hadley Center-UK; Meteo France; Max Planck Institute-Germany, NOAA-USA, etc.) develop models that show considerable convergence in some parameters (temperature), while being more uncertain in others (such as precipitation or wind). From these models, the foreseeable consequences for different scenarios are estimated, generally considering multiple models, in order to analyze whether these risks are more or less probable (they would be more probable when most of the models estimate the same conditions). Based on these simulations, and despite the fact that some places may benefit from warming (for example, milder temperatures in boreal latitudes that may allow them to introduce new crops), the speed and magnitude of the estimated changes point to very negative consequences for the entire planet if current emission rates are maintained. Among the effects on which there is considerable scientific consensus are the rise in sea water level (which could reach between 45 and 80 cm by the end of the century), with its impacts on the enormous coastal population of the planet and the frequency of floods, heat waves (which would affect the health of the most vulnerable population, increase forest fires and crops degradation), the loss of glaciers (especially affecting countries with less capacity of water storage), the frequency of tropical storms, and changes in the transmission vectors of some diseases. In this regard, a recent report by the World Health Organization (WHO) estimates that "between 2030 and 2050 climate change will cause an additional 250,000 deaths per year, due to malnutrition, malaria, diarrhea and heat stress" (http://www.who.int/mediacentre/factsheets/fs266/es/).